MCTP: A Multi-Modal Crop Phenotyping Data Processing Platform
A desktop platform that processes hyperspectral, LiDAR, RGB and thermal phenotyping data with one interface, interactive parameter tuning, batch processing and structured exports.
 Liangchao DengPostdoctoral Researcher
Overview
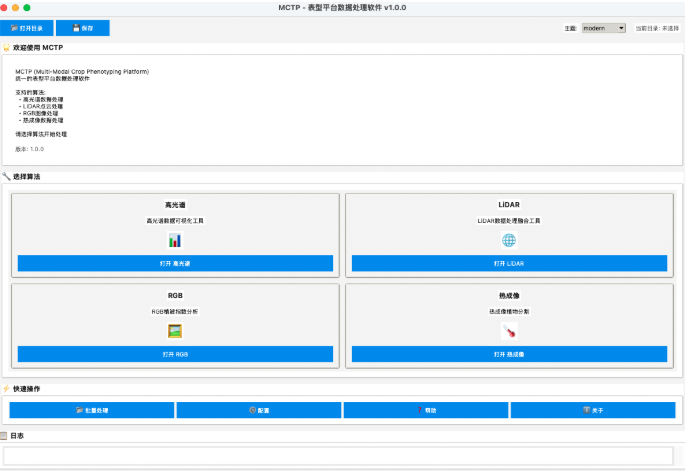
A field phenotyping campaign with a walking platform produces four very different data types for every plot: hyperspectral cubes, LiDAR point clouds, RGB images and thermal images. Each normally needs its own software, parameter conventions and export format, which makes multi-modal trait analysis slow and hard to reproduce.
MCTP (Multi-modal Crop Trait Processing) puts the four modalities into one desktop platform with a shared interface, interactive parameter tuning, batch processing and structured exports. It was developed for the field walking phenotyping platform of Shufeng Bio; I was responsible for system optimization and for the data-processing and analysis methods.
Modules
Hyperspectral (HyperVis)
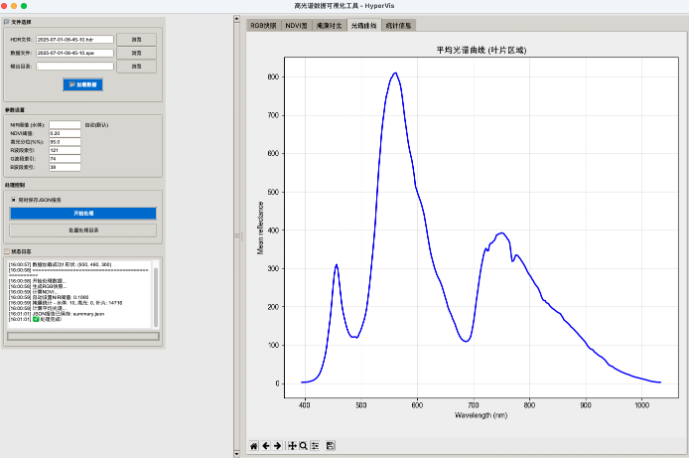
- Reads ENVI HDR/SPE pairs and parses wavelength metadata.
- Detects the bands needed for vegetation indices from the wavelengths.
- Computes NDVI, builds plant masks with NIR thresholding, and removes specular glare with a percentile mask.
- Exports the leaf-region mean spectrum (CSV) and summary statistics (JSON).
- Shows RGB quicklook, NDVI, mask comparison, spectral curves and statistics in tabs.
- Processes whole directories of HDR/SPE pairs in batch.
LiDAR
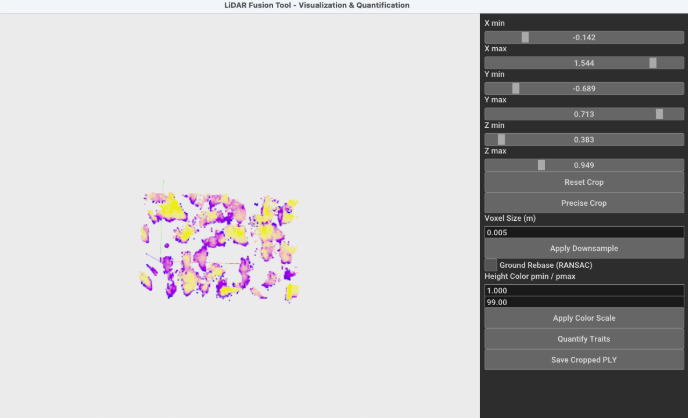

- Reads PLY, LAS, LAZ and text point clouds.
- Rebases the ground plane with RANSAC, then voxel-downsamples, crops and colours by height.
- Segments plants with DBSCAN, tuned interactively in the SegTuner window.
- Computes canopy and plant traits: ground coverage, voxel occupancy, convex-hull volume and height percentiles H10, H50 and H90.
- Exports cropped point clouds and JSON trait reports.
RGB
- Segments vegetation by combining three colour indices, ExG, CIVE and VDI, with a joint threshold.
- Suppresses glare from water and plastic, and removes labels and borders.
- Keeps thin plants with adaptive morphology and skeleton enhancement.
- Separates individual plants with watershed and connected-component labelling.
- Exports overlay images, plot-level JSON metrics and per-plant CSV tables.
Thermal
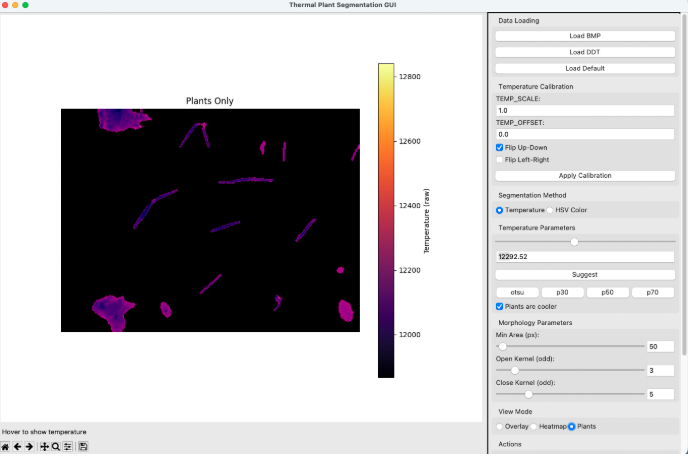
- Loads BMP images with their DDT temperature matrices, with flipping and calibration.
- Suggests thresholds from Otsu's method and percentiles.
- Tunes temperature thresholds, HSV range and morphology with sliders.
- Previews overlay, heatmap and plant-only views.
- Exports PNG, NPY, CSV and JSON results.
Shared design
- One interface for all four modalities: control panel, live preview and processing log in the same layout.
- Interactive tuning with sliders, suggested thresholds and real-time previews, so parameters are set by inspecting the data.
- Batch processing for hyperspectral and RGB data; saved parameters are reused across samples for LiDAR and thermal data.
- Structured outputs in JSON and CSV, ready for statistics in R or Python and for trait–yield modelling.
Recommended use
- Archive the raw data and acquisition metadata unchanged.
- Open a representative sample and confirm file pairing, orientation and units.
- Tune parameters on the preview and check the difficult cases.
- Process a small batch and compare with the raw data, then scale up.
- Store thresholds, voxel sizes, clustering settings and the software version with the results.
Scope and roadmap
The four modules process each modality separately and share conventions for parameters and exports; they do not yet register the modalities to each other. The next steps are cross-modal registration, time-series analysis across campaigns, shared project configuration templates, and batch processing and reporting on a server.
To try MCTP or obtain sample data, see the contact details on the CV page.

Discussion
Questions or field notes?